The plastic we made
And the plastic we now live with
Plastic began as a promise.
A lightweight material that could replace scarce natural resources. A polymer that could make products safer, cheaper, longer lasting. In the middle of the twentieth century, plastic was a symbol of progress.
The early decades of plastics were framed almost entirely as a materials revolution. Plastics were strong yet light, moldable yet durable, and inexpensive enough to scale across entire industries. They quickly replaced metal, wood, glass, and natural fibers in thousands of everyday products. Food packaging became lighter. Medical equipment became safer and disposable. Consumer goods became cheaper and more accessible.
In 1950 the world produced roughly two million tonnes of plastic per year. Today we produce more than 430 million tonnes annually [1-2].
That expansion happened quietly but relentlessly. Plastic production grew faster than almost any other manufactured material in modern history. New polymers were introduced. Petrochemical capacity expanded. Global trade networks scaled the supply chain. Plastics moved from niche industrial uses into nearly every sector of the economy: construction, transportation, electronics, medicine, textiles, agriculture, and food packaging.
In just a few generations, plastic quietly became one of the dominant materials of modern civilization.
But the story of plastic is not just about how much we make.
It is about what happens next.
A material that accumulates
Plastic production has grown almost continuously since the middle of the twentieth century.
From 2 million tonnes in 1950, production rose to roughly 35 million tonnes by 1970, 120 million tonnes by 1990, and more than 380 million tonnes in 2015 [1]. Recent estimates place global plastics production between 400 and 430 million tonnes annually, depending on system boundaries used by different reporting organizations [2-3].
What matters here is not only the magnitude, but the direction. The curve has kept rising. Even when researchers use slightly different accounting systems, the conclusion does not really change. We are not looking at a material that plateaued and stabilized long ago. We are looking at a material class that is still expanding, still spreading through global supply chains, and still generating downstream waste at an extraordinary scale.
Most of this production is dominated by a small number of polymer families.
Polyethylene (PE) and polypropylene (PP) alone account for a large share of global production. Together polyolefins (PE and PP) dominate the system comprising about 57% of all plastic produced. Other major polymers include polyvinyl chloride (PVC), polyethylene terephthalate (PET), polystyrene (PS), and polyurethane (PU) [1,3].
| Year | Total (Mt) | PE | PP | PVC | PET | PS | PU | Other |
| 1950 | 2.0 | 0.7 | 0.4 | 0.2 | 0.2 | 0.2 | 0.2 | 0.1 |
| 1970 | 35.0 | 12.7 | 7.4 | 4.1 | 3.6 | 2.7 | 2.9 | 1.7 |
| 1990 | 120.0 | 43.6 | 25.2 | 14.2 | 12.2 | 9.1 | 9.8 | 5.9 |
| 2010 | 313.0 | 113.6 | 65.7 | 36.9 | 31.9 | 23.8 | 25.7 | 15.3 |
| 2015 | 381.0 | 138.3 | 80.0 | 45.0 | 38.9 | 29.0 | 31.2 | 18.7 |
| 2021 | 394.2 | 143.1 | 82.8 | 46.5 | 40.2 | 30.0 | 32.3 | 19.3 |
| 2024 | 430.9 | 156.4 | 90.5 | 50.8 | 44.0 | 32.7 | 35.3 | 21.1 |
These polymer families underpin the majority of modern plastic applications. Polyethylene is widely used in packaging films, bags, and containers. Polypropylene is common in food packaging, automotive parts, and consumer products. PVC dominates piping and construction materials. PET is ubiquitous in beverage bottles and synthetic fibers. Polystyrene appears in packaging foams and disposable food containers. Polyurethanes are used in foams, insulation, coatings, and adhesives.
Together these polymers represent the structural core of the modern plastics system.
Each polymer behaves differently in the environment. But most share one defining trait.
They persist.
Waste follows production
As plastic production grew, plastic waste grew with it.
By 2019 the world generated approximately 353 million tonnes of plastic waste annually [3].
This waste stream reflects the same structural dynamics that drove plastic production. Many plastics are used in short lived applications, particularly packaging, which often enters the waste stream within months or even days of manufacture. Globalized consumption patterns, single use product formats, and rapidly expanding synthetic textiles have all contributed to the scale of plastic waste generation.
What happens to that waste reveals something important about the modern plastics system.
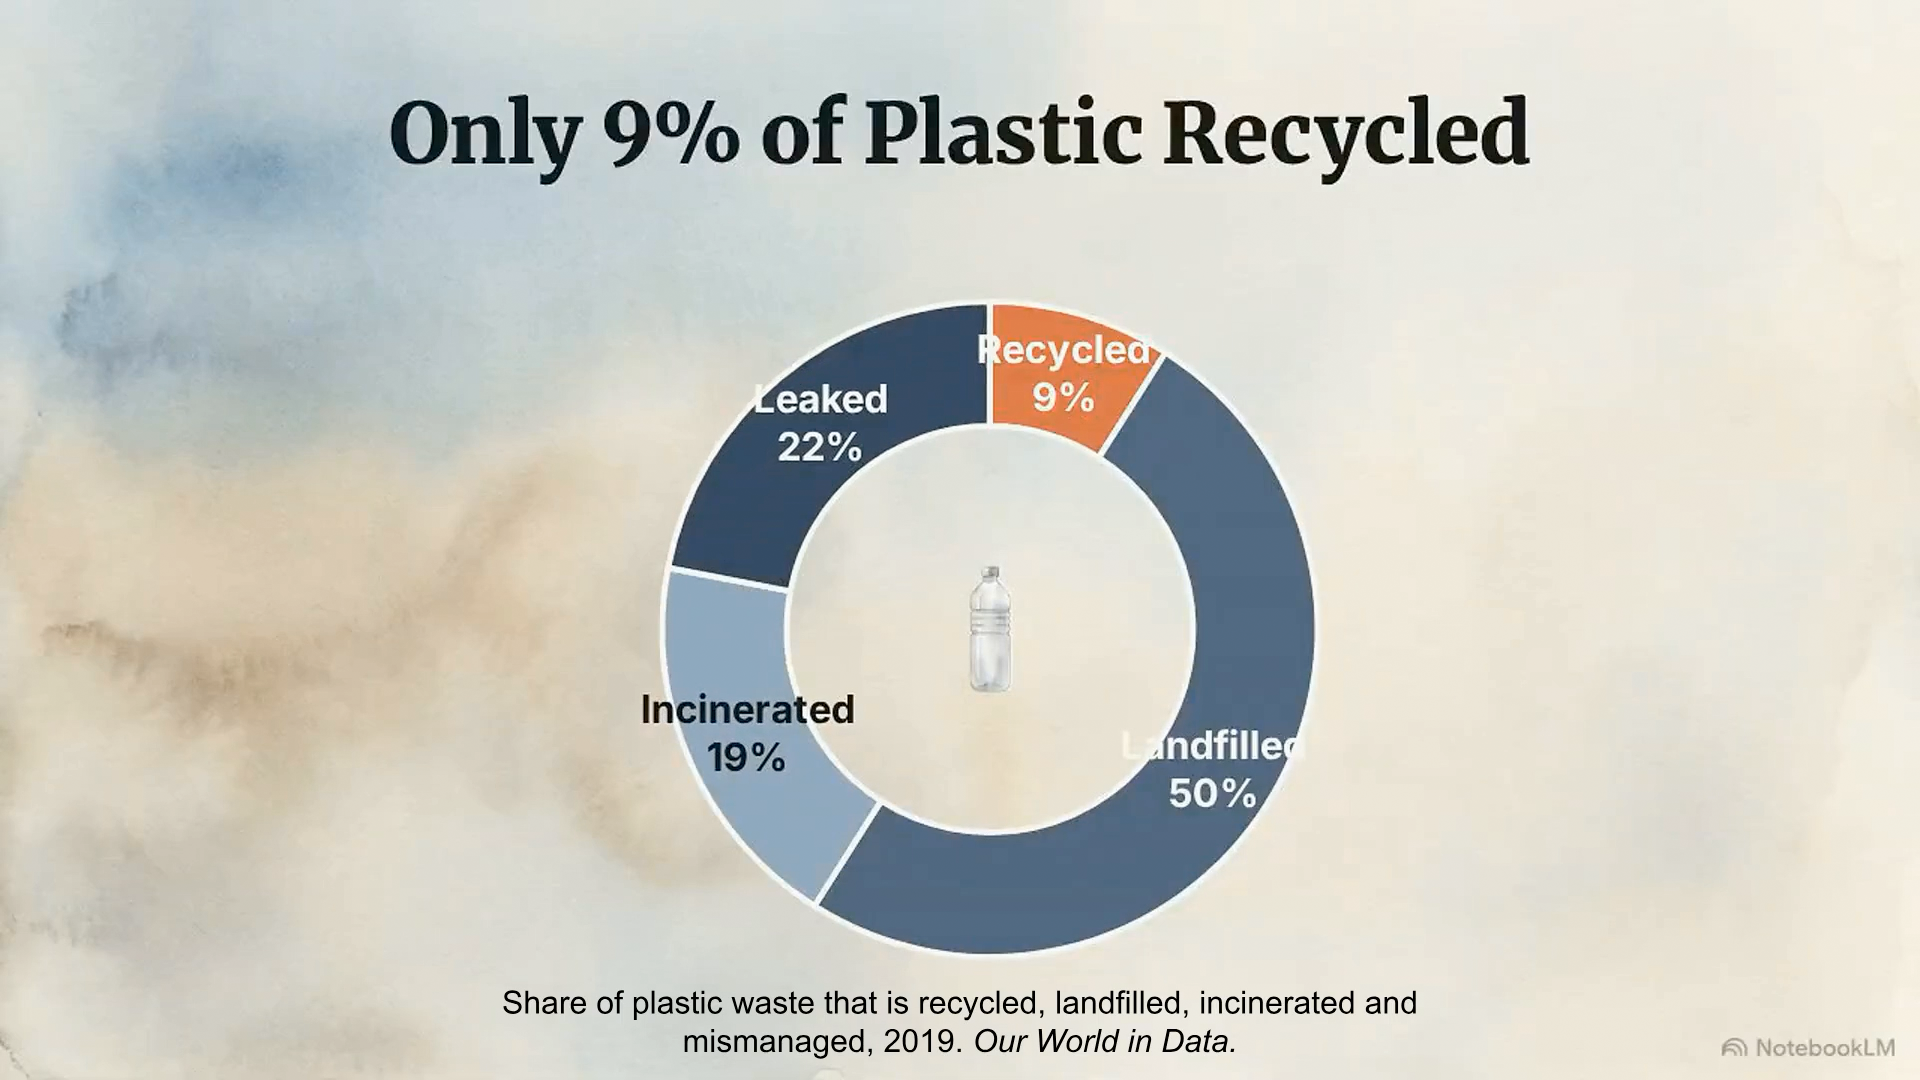
According to the OECD global plastics assessment:
- 9% of plastic waste is ultimately recycled
- 19% is incinerated
- ~50% is landfilled
- ~22% is unmanaged or leaks into the environment [3]
These numbers highlight a structural imbalance between plastic production and waste management capacity. While recycling has expanded in some regions, the global recycling rate remains relatively low due to polymer complexity, contamination, economic constraints, and infrastructure limitations. Many plastics cannot be easily recycled into equivalent products. Others are downcycled into lower value materials.
In other words, the majority of plastic ever produced still exists somewhere in the world.
Some of it is buried in landfills.
Some of it is still in products.
And some of it is no longer contained.
The plastic we can see
For years the public image of plastic pollution focused on the ocean.
Floating bottles. Fishing nets. Debris accumulating in distant gyres.
These images were powerful, but incomplete.
When scientists began measuring plastics in the ocean more carefully, they discovered something surprising.
The visible surface plastic represents only a small fraction of total marine plastic mass.
One synthesis estimated roughly 0.27 million tonnes of plastic floating on the ocean surface [4].
But more recent global mass budget analyses suggest that the total mass of buoyant plastics in the ocean may exceed three million tonnes, with additional large reservoirs in sediments and subsurface waters [5].
A global ocean plastics box model further suggests that more than 260 million tonnes of plastic may have accumulated in marine systems since 1950 [6].
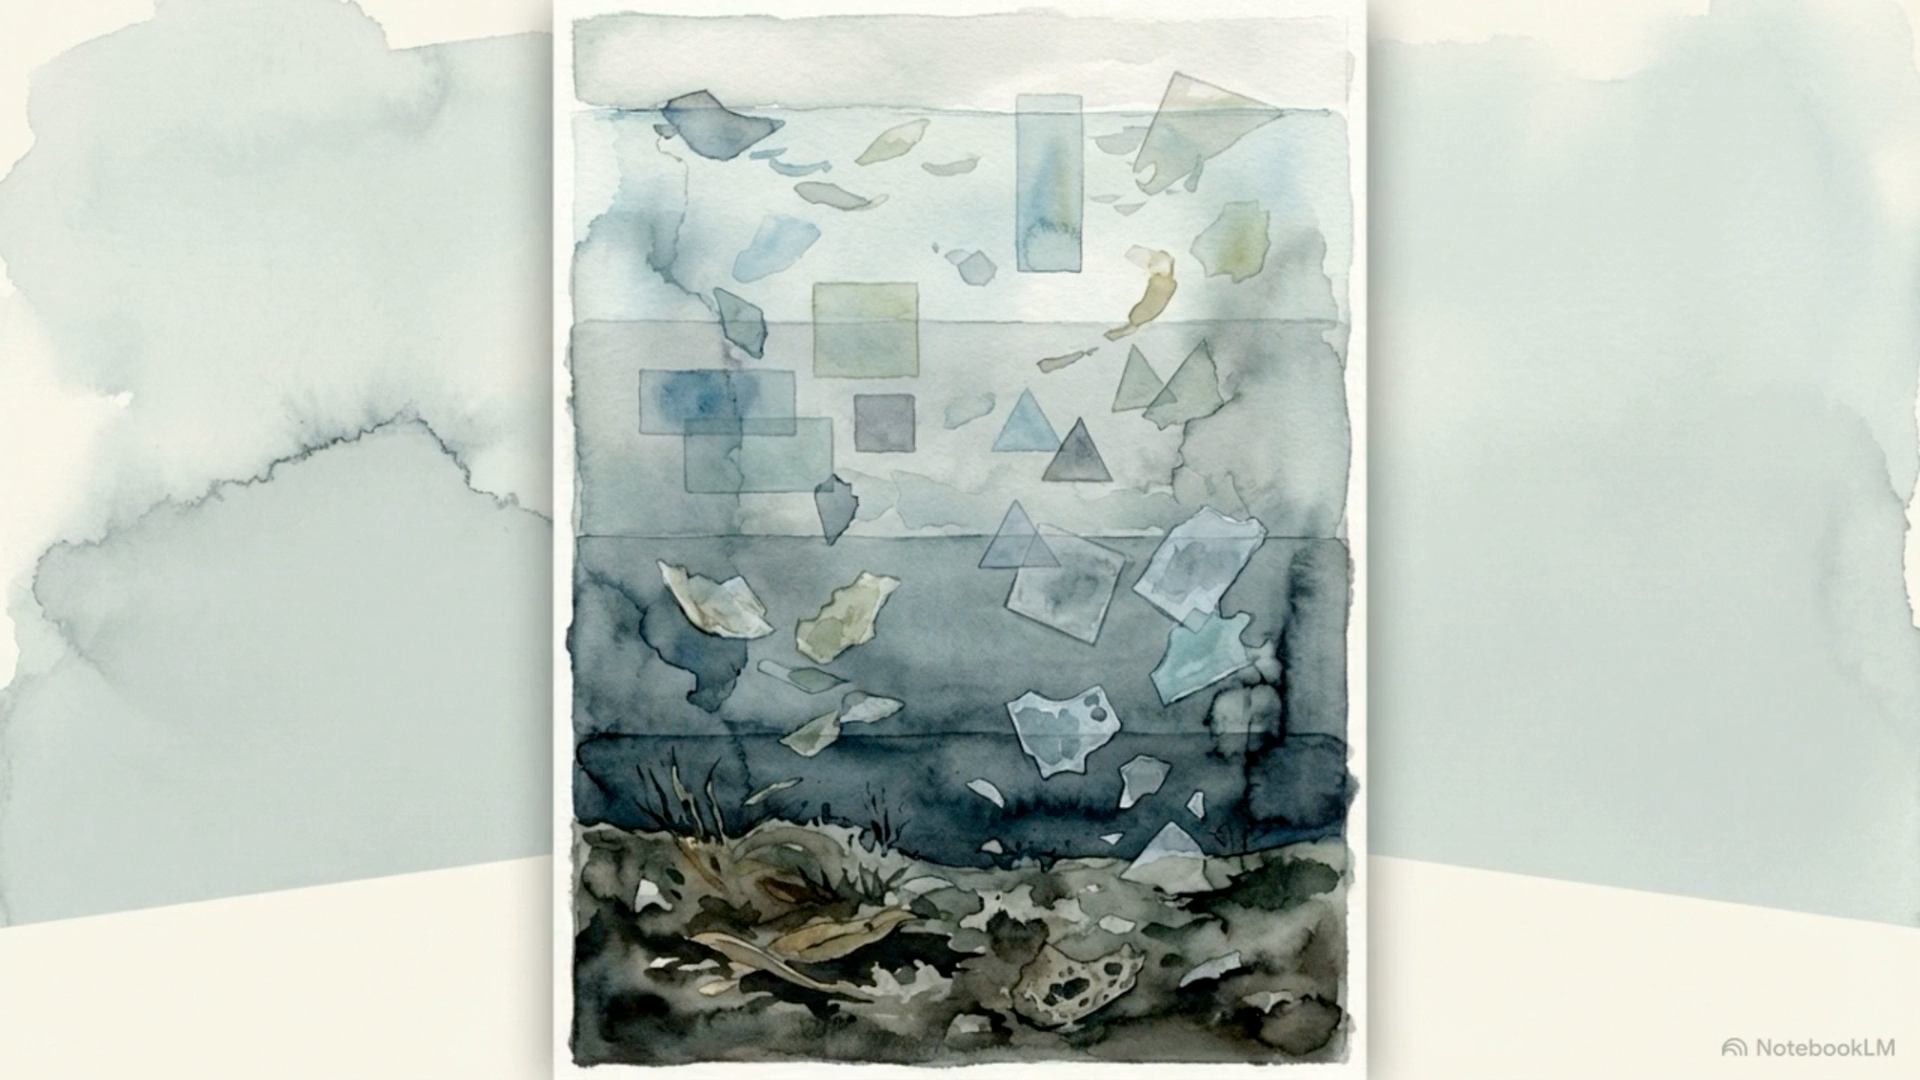
The discrepancy between visible debris and total environmental plastic reflects the complex physical behavior of polymers in natural systems. Plastic particles can fragment, sink, become colonized by microbial communities, or mix vertically through ocean currents and turbulence. As a result, much of the plastic entering marine environments may quickly leave the surface layer where it is easiest to observe.
Most of it is not floating.
It is dispersed throughout the water column.
Or buried in marine sediments.
The plastic we cannot see
The ocean is only one part of the story.
Plastic also accumulates across land and freshwater environments.
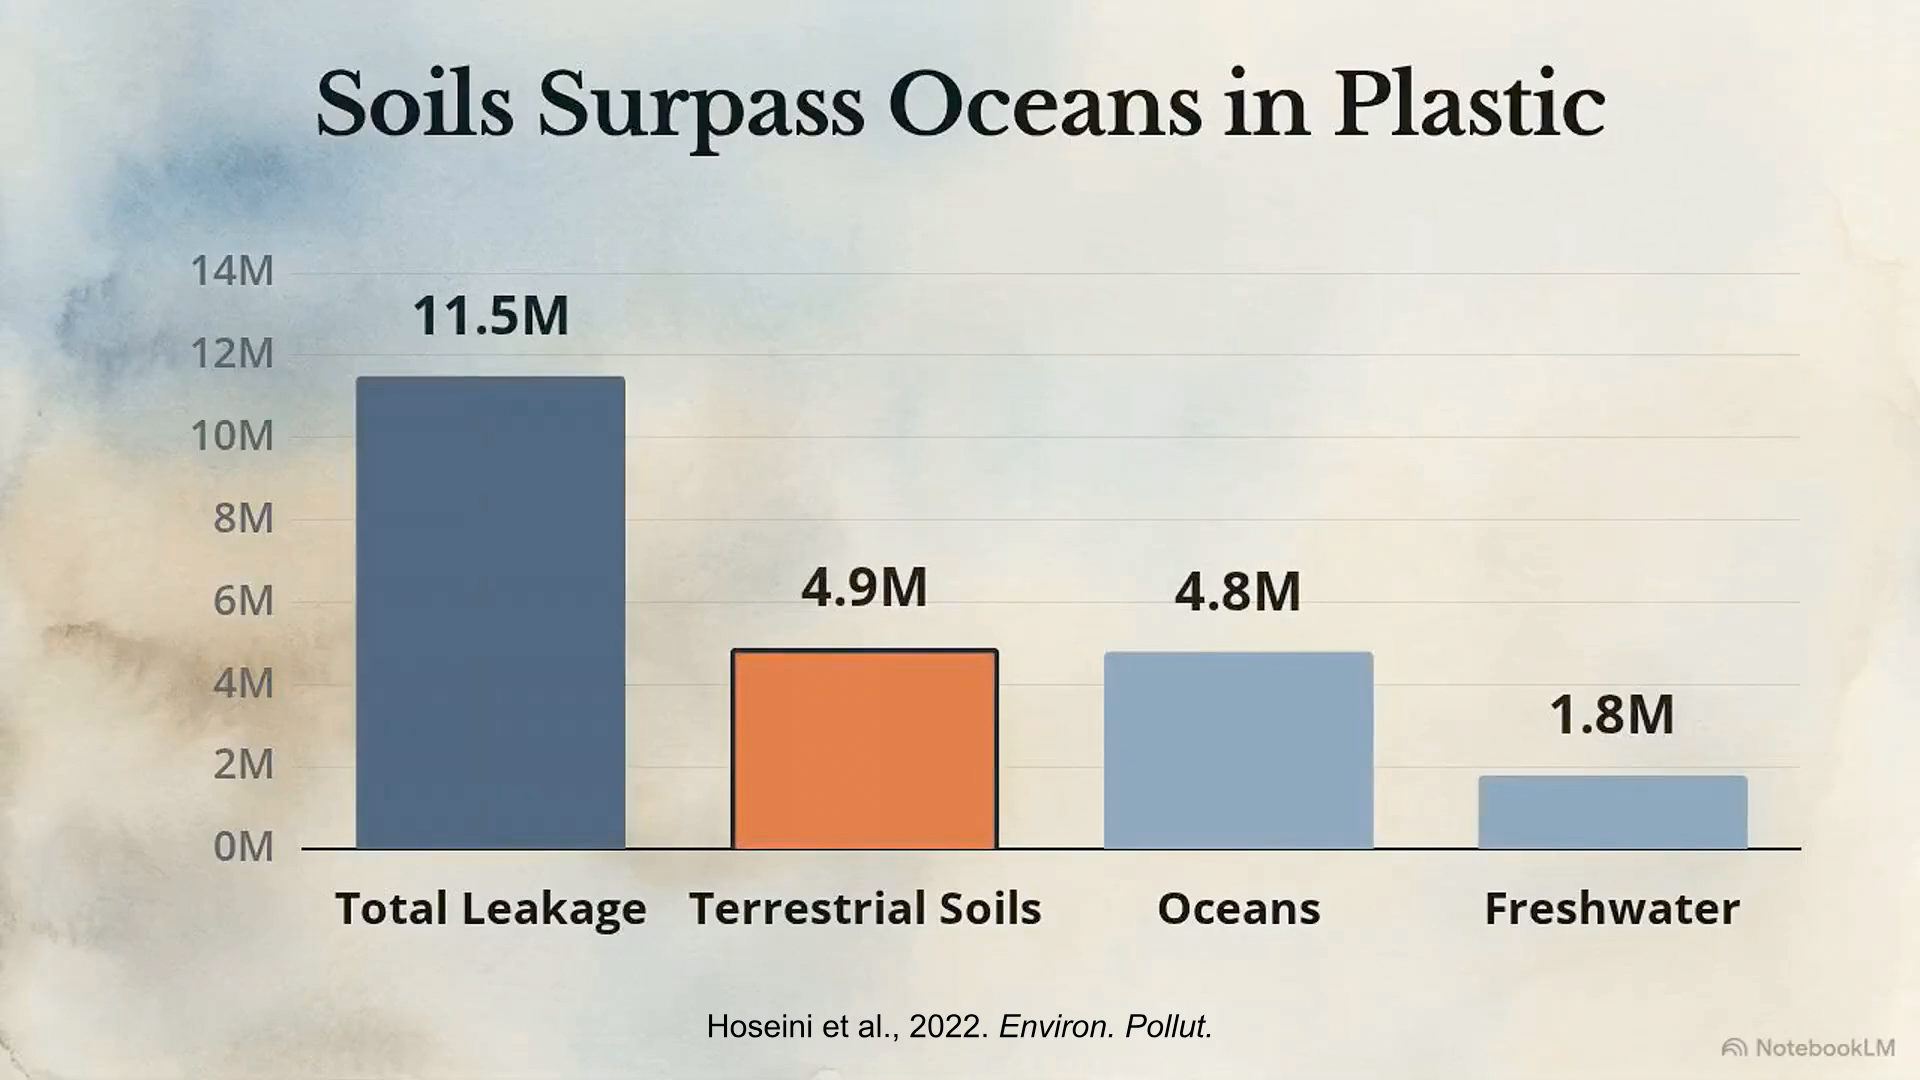
A probabilistic global polymer distribution model estimates that each year approximately 11.5 million tonnes of plastic enter environmental systems, distributed across soil, freshwater, and marine compartments [7].
Of that total:
- roughly 4.9 million tonnes accumulate in soils
- roughly 4.8 million tonnes enter the ocean
- roughly 1.8 million tonnes enter freshwater systems
These findings challenge the common perception that plastic pollution is primarily a marine problem. In reality, a substantial share of plastic leakage occurs on land. Tire wear particles accumulate along roads and urban surfaces. Synthetic textile fibers shed during washing and disperse through wastewater systems. Agricultural plastics fragment into soils. Atmospheric transport can carry microplastics across continents.
This means much of the plastic entering the environment today remains on land.
Urban soils. Agricultural soils. Road dust. Atmospheric fallout.
These are increasingly recognized as major environmental reservoirs.
Polymer identity shapes where plastics end up
Not all plastics behave the same way.
The density and chemistry of a polymer strongly influence where it accumulates.
Polyethylene and polypropylene are less dense than water and often float initially [8]. PET, PVC, and many other polymers are denser than water and tend to sink more readily, accumulating in sediments [8].
These physical properties influence the pathways plastics take through environmental systems. Lower density polymers are more likely to travel long distances across the ocean surface before eventually fragmenting or becoming biofouled. Denser polymers often settle quickly into sediments, where they may persist for decades or centuries with limited degradation.
But buoyancy is not permanent.
Biofouling and particle fragmentation can eventually transport even floating plastics into the water column and ocean floor [5]. Once there, plastics may also interact with the ocean’s biological carbon pump. Microplastics can become embedded in “marine snow” and other organic aggregates that normally transport carbon from the surface ocean to the deep sea. Laboratory and field studies suggest these interactions can alter aggregation, sinking behavior, and microbial activity in ways that may influence how efficiently the ocean stores carbon [5,7,10-12]
Plastics rarely disappear
When plastics degrade, they rarely mineralize completely.
Instead they fragment.
Sunlight, mechanical abrasion, and chemical oxidation break large plastic objects into smaller particles over time [9].
These processes produce microplastics and nanoplastics without eliminating the underlying polymer mass.
A global plastics box model suggests that macroplastics may fragment into smaller particles at roughly three percent per year on average, although this varies widely by environment and polymer type [6].
Fragmentation changes the form of plastic pollution rather than removing it. Large objects break into smaller pieces. Those pieces disperse more widely through water, air, and soils. Over time they may reach microscopic sizes that are difficult to detect or remove.
In practical terms, plastic entering the environment today may persist for decades or centuries.
Often simply in smaller pieces.
The stock we are building
When researchers combine production data, waste flows, and environmental transport models, a broader picture emerges.
One synthesis estimates that by the mid 2010s the marine environment alone had accumulated approximately 263 million tonnes of plastic [6].
When terrestrial and freshwater reservoirs are considered as well, total environmental plastic stocks may already approach hundreds of millions of tonnes globally [7].
These numbers represent accumulated material rather than annual flows. Plastic pollution behaves more like a growing environmental stock than a temporary contaminant. Each year adds new material to systems that already contain decades of historical inputs.
And by 2100, the amount of plastic in each of these systems is unfathomable, even if stark action is taken (left current trajectory, right strong action, units in teragrams or 1,000 billion grams) [6].
The uncertainty around these estimates is large.
But the trajectory is clear.
The plastic produced over the past seventy years is still with us. And the plastic we are about to produce will shape the environmental systems our children inherit.
What happens next
The future of environmental plastics depends less on what we produced decades ago and more on how we manage the plastics entering the waste stream today.
If current leakage patterns continue, models suggest environmental plastic stocks could grow dramatically over the coming decades.
Order of magnitude projections based on current accumulation rates suggest:
- ~100 million tonnes of additional plastic could accumulate within the next decade
- hundreds of millions of tonnes over the next thirty years
- multiple gigatonnes over the next century under business as usual condition
These projections reflect the compounding nature of plastic accumulation. Even modest annual leakage rates can produce enormous environmental stocks when multiplied across decades of production growth. Conversely, improvements in waste management, material design, recycling technologies, and consumption patterns could significantly alter the long term trajectory.
These projections are uncertain.
But they highlight a central reality.
Plastic production is not only a manufacturing story.
It is also an environmental accumulation story.
A measured response
Plastic cannot be removed from modern life overnight.
But exposure can often be reduced in practical ways.
Reducing heated food contact with plastic is one of the clearest steps. Glass, ceramic, and stainless steel are often better options for hot food and drinks. Bottled water can be reduced where clean filtered alternatives are available.
Tools like Winnow can also play a role.
Plastic rich contact points such as takeout containers, lined lids, and synthetic tea bags are worth paying more attention to, especially during pregnancy, early childhood, and preconception.
These actions do not eliminate plastic exposure entirely. But they can reduce some of the highest intensity contact points in daily life. At the same time, broader systemic changes in materials design, waste management infrastructure, and industrial policy will ultimately shape the scale of environmental plastic accumulation. Small changes rarely feel dramatic in the moment. But like erosion, quiet forces repeated over time can reshape landscapes, especially when we work together.
The goal is not purity.
It is not fear.
It is thoughtful reduction where reduction is feasible.
Because the plastic we made does not simply disappear.
It becomes part of the world we now live in.
References
- 1.↑ Geyer, R., Jambeck, J. R. & Law, K. L. Production, use, and fate of all plastics ever made. Sci. Adv. 3, e1700782 (2017). Grida
- 2.↑ PlasticsEurope. Plastics The Facts 2025. Plasticseurope
- 3.↑ OECD. Global Plastics Outlook: Economic Drivers, Environmental Impacts and Policy Options. https://www.oecd.org/content/dam/oecd/en/publications/reports/2022/02/global-plastics-outlook_a653d1c9/de747aef-en.pdf; Share of plastic waste that is recycled, landfilled, incinerated and mismanaged, 2019. Ourworldindata
- 4.↑ Eriksen, M. et al. Plastic Pollution in the World’s Oceans: More than 5 Trillion Plastic Pieces Weighing over 250,000 Tons Afloat at Sea. PLoS ONE 9, e111913 (2014). AtlasPubMed
- 5.↑ Kaandorp, M. L. A., Lobelle, D., Kehl, C., Dijkstra, H. A. & Sebille, E. van. Global mass of buoyant marine plastics dominated by large long-lived debris. Nat. Geosci. 16, 689–694 (2023).
- 6.↑ Sonke, J. E., Koenig, A., Segur, T. & Yakovenko, N. Global environmental plastic dispersal under OECD policy scenarios toward 2060. Sci. Adv. 11, eadu2396 (2025). AtlasPubMed
- 7.↑ Hoseini, M. & Bond, T. Predicting the global environmental distribution of plastic polymers. Environ. Pollut. 300, 118966 (2022). PubMed
- 8.↑ Environment and Climate Change Canada. Science Assessment of Plastic Pollution. Canada
- 9.↑ Chamas, A. et al. Degradation Rates of Plastics in the Environment. ACS Sustain. Chem. Eng. 8, 3494–3511 (2020).
- 10.↑ Zhang, Y. et al. Plastic waste discharge to the global ocean constrained by seawater observations. Nat. Commun. 14, 1372 (2023). PubMed
- 11. Brahney, J., Hallerud, M., Heim, E., Hahnenberger, M. & Sukumaran, S. Plastic rain in protected areas of the United States. Science 368, 1257–1260 (2020). PubMed
- 12.↑ Kvale, K. Implications of plastic pollution on global marine carbon cycling and climate. Emerg. Top. Life Sci. 6, 359–369 (2022). PubMed
Sign in to start a discussion.